With 200%+ returns per annum since 2010, Bitcoin has generated one of the best investment returns in recent years, perhaps ever! It has also experienced massive volatility and huge drawdowns during the 4 bull and 3 bear markets since its creation in 2009. HODLers who average their purchase prices through time and don’t intend to sell for many years to come, experience the volatility of the bull-bear cycles, but tend to be less phased by the emotional rollercoaster because their consistent investment strategy has generated strong returns. According to daily data since July 2010, bitcoin only briefly experienced negative rolling 3-year returns - between the peak of the 2013 bull-market in November and November 2016. Buying and holding for longer than 3.5 years proved a very profitable strategy no matter the starting price. Given my investment background, my concentrated allocation and experience during the 2017 euphoria and subsequent bear-market, I’d like to have a better investment strategy for forthcoming cycles than just buy and hold. If bitcoin becomes a widely used global reserve asset, then the price will be numerous orders of a magnitude higher than today. But this will take time and there will probably be numerous bull and bear markets as we approach that outcome. If the market enters of a new euphoric stage, I’d like an analytical foundation in order to assess portfolio rebalancing during future bull-markets and create a more diversified personal investment portfolio.
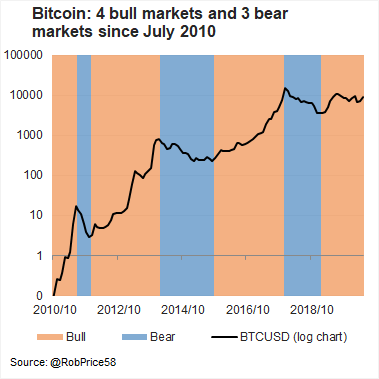
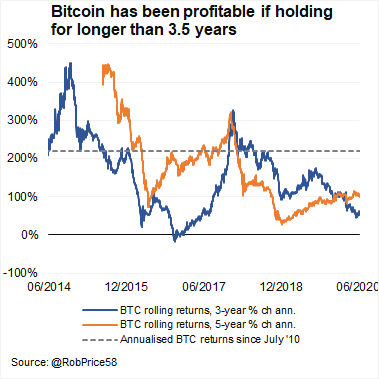
In this piece I present a few analytical measures (valuation, price discovery, sentiment and relationship to traditional markets) to assess the stage of bull and bear markets. Unfortunately, the data history isn’t wonderful yet, but I think the analysis provides a decent base, and it will improve over time. It’ll provide better entry and exit indicators than purely judging technical charts or assessing the mood from friends and twitter. These indicators do not serve as a fundamental investment case for bitcoin, nor do they serve as investment advice. I presented a foundational understanding of the case for store of value commodities like bitcoin here. An investment case should be based on sound money principles - I’d recommend Vijay Boyapati’s article. I assume readers of this article have a reasonable understanding of the actual technology and investment case. Bitcoin is highly volatile, risky and likely bad idea if you don’t understand the underlying value of the technology. I’m looking forward to your feedback and criticism so that I can push the research forwards.
Relative Store of Value Valuation
Bitcoin’s constrained supply schedule combined with its ability to function as a base-layer settlement network for large payments, its security features and its relatively low cost of storage, implies that it has store of value characteristics. Store of value is undervalued as a financial attribute, which creates a very constructive outlook for both gold and bitcoin. The collapse in WTI futures into negative territory in April 2020 provides a interesting real world example of the challenge investors face when storing value.
I’m not going to get into the gold vs. bitcoin debate, I’m bullish on both. I do think that the relative valuation is an interesting exercise though. If bitcoin were to compete with gold’s market share, where could we value it?
There is approximately $10.6tn worth of above ground gold with approximately $2.2tn held as private investment and $1.8tn held by official institutions. Narrowing in on private investment as this component is most comparable with bitcoins store of value features, the bitcoin market equates to approximate 7%.
At current gold prices ($1730) and current bitcoin supply (18.4mn coins), if bitcoin were to grow to 10%, 20% or 30% of the private investment gold market, the bitcoin price would be $13.2K, $26.5K or $39.8K respectively.
If one wants to get a little more nuanced and create more optimistic price target ranges, one can play around with the bitcoin supply and gold price assumptions. A certain amount of bitcoin supply has been lost and will never return to circulation, which should boost the price of the remaining supply. In the table below we reduce the current bitcoin supply by 5% from 18.2mn coins to 17.5mn coins in scenarios 2 and 3 for the constrained supply scenarios, which further boosts the potential price targets. Scenario 3 also includes an increase in the gold from $2000/oz.
Wide price ranges highlight the difficult of making price targets but also shows the massive appreciation potential if gold investors realise the attractive store of value characteristics offered by bitcoin. Even if 30% market share under scenario 3 ($48.6K) is only 10% likely over the next 5 years and one assumes a 90% probability that the bitcoin price is flat over this period, that still a expected value return of approximately 8% annualised. This is a pretty attractive uncorrelated source of potential return.

Over time bitcoin could compete with gold held by official institutions. This will probably take another 10 to 20 years but it’s worth considering given the fractures within the financial system and the Fed’s shift towards zero interest rate policies again. At current gold prices, if bitcoin were to grow to 10%, 20% or 30% of the private investment & official gold markets combined, the bitcoin price would be $24K, $48K and $72K respectively.
Stock-to-Flow
Another lens to assess bitcoin’s deflationary supply schedule is stock to flow (S2F). The deflationary supply schedule implies there is a large stock of bitcoin available relative to the amount that are mined each year (flow) and added to the existing supply. Bitcoin’s S2F stands at 50 after the halving in bitcoin supply growth in May, which compares to 62 and 22 for gold and silver respectively A Dutch financial quant called “Plan B” has done a lot of great work on stock-to-flow. His statistical analysis argues that the value of the bitcoin network (and thus price) can be purely determined by its scarcity. I’m always cautious of purely quantitative models but historically, this model has worked well with scarce assets like gold, silver and bitcoin, generating a 99% R2. This model predicts a bitcoin price of $100K during 2021.
Both these valuation measures are variable, which highlights the uncertainty of the analysis but prices below $10K are extremely cheap. Given the uncertainty of these measures, I’m not looking for specific price targets to trigger selling activity. Rather, I’d like to assess signs of exhaustion within the underlying market, which I include below.
Transaction Valuation more reasonable
The Price-Earnings ratio (PE) is used in traditional finance to value corporate equities. Analysts have created a Market Capitalisation to Transaction Value as a bitcoin alternative. When the market capitalisation is low relative to transaction values then the network is reasonably cheap and when market capitalisation is high relative to transaction value then the network is expensive. This valuation measure held a reasonable relationship through previous bull and bear markets, spiking near the end of bull-markets as market value rises but actual transaction value declines. This measure has also provided a strong indication of subsequent returns, seeing 56% annualised gains when valuation was above 150 and 723% annualised gains on average when valuation was below 60.
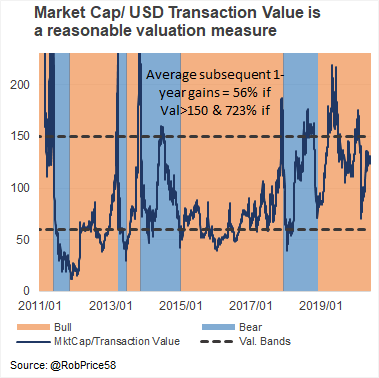
After following its usual pattern and falling sharply in the most recent bear market, valuation rose uncharacteristically quickly during the most recent bull market. This tells us that the market value of the network rose but wasn’t matched by a commensurate increase in transactions. One could argue that transactions are moving across to the lightening network but, from my understanding of the lightening network, it hasn’t reached a level where it is competing with the main chain yet. One could also argue that this valuation metric is biased towards assessing use-case value-add of the network rather than store-of-value value-add. While this is a valid criticism of the measure, it was similarly valid during previous bull-markets. Perhaps the current cycle will be more driven by store-of-value (SoV) characteristics of bitcoin rather than actual use-cases like cross-border capital flows. And perhaps this implies that the valuation measure will remain more elevated throughout the cycle?
That’s a tricky question to answer. Either way, I wouldn’t use one indicator as the be-all-and-end-all. But it is encouraging that valuation, according to this indicator, isn’t at frothy extremes.
Network Valuation: Not in euphoria yet but there is cause for concern
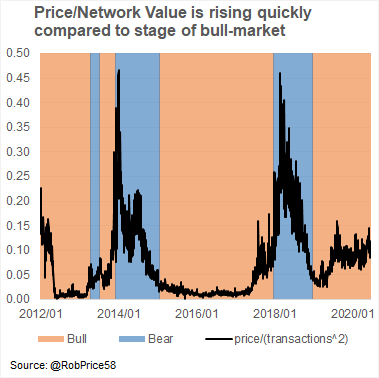
In the 1980s, Robert Metcalfe, the inventor of Ethernet, suggested that the value of a telecommunications network is proportional to the square of the number of connected users of the system (n²). We assess price (or market capitalisation) relative to the network value as defined by transactions squared. This measure provides a reasonably similar conclusion to the previous valuation measure. Price becomes stretched relative to network value in the euphoria stage at the end of bitcoin bull markets. A sustained rise in this ratio could be used as an indicator of overvaluation and a time to take profits on long positions. By contrast, low valuations are associated with strong subsequent performance. When the price/network value is below 0.05, the average subsequent 1-year returns were 780%, while the average 1-year subsequent returns were 104% when the indicator was above 0.1. Similarly, to the previous measure, valuation rose quickly in 2019 for such an early stage of the bitcoin bull-market, which should have served as a warning sign, tempering enthusiasm. Currently, we’re situated at 0.104, which isn’t extremely cheap.
Google Trends | Retail newbies haven’t emerged yet
Google searches are frequently used as an indicator of BTC sentiment. Searches trend higher over time interest grows, with extreme volatility around the trend as interest periodically explodes to unsustainable bubble levels. Judging the next bull-market by the merely google trends data wouldn’t be wise due to the trend.
Normalising by the real-time historical average, google searches differentiate bull and bear cycles well (above, right). The actual cycles shown by the shaded bars were determined by BTC peak and trough price cycles (same as the previous graphs).
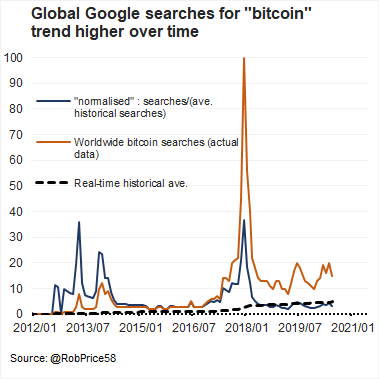
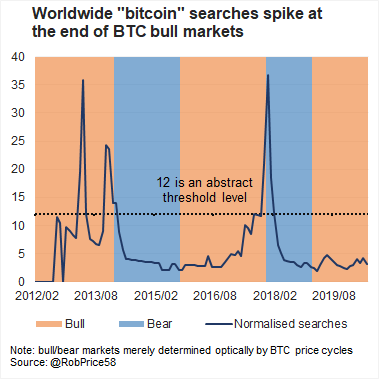
I assess levels on the normalised indicator below 5 as bullish, which has happened 66 times (monthly data since 2012). Subsequent 1-year compounded BTC were 138% when the indicator is below 5, since Jan 2012 (when data seems reasonably reliable for this indicator). In the current bull market exhaustion red flags will emerge when the normalised measure rises above approximately 12. Normalised levels above 12 have seen subsequent 1-year compound bitcoin declines of 26% (with notable variability below the surface). Bear in mind that there were far fewer observations of this exhaustion signal (only 12 since 2012) because we’ve only experienced the 2013 and 2017 bubbles during the analysis period.
These numbers aren’t forecasts by any stretch! It’s just an indication that low levels trend to be related to higher subsequent moves in price. Future price appreciation is unlikely to rival historical due to increasing adoption, liquidity and greater usage of financial strategies, which should generate increasing price stability relative to the more unground nature of the BTC market previously. Second, the number of data points still isn’t truly reliable for an indicator. Third, price forecasts are a fools game.
Actual google searches would need to rise above 90 over the next year (from 15 in June 2020) to take the normalised measure towards 12 and begin to create a sell-signal. We’ll continue to monitor this indicator, in conjunction others, to build a body of evidence for buy/sell signals in the current bull market. For now, the signal suggest that accumulation remains worthwhile.
Cross-Exchange Spreads | Good price discovery
When bull-markets are stretched, price discovery is ineffective. Latecomers to the mania are trying to purchase with very little appreciation of price, value or the potential volatility. Under these conditions pricing becomes sloppy and large arbitrages can exist between exchanges. There was some evidence of this during the last bull-market when the spread between prices submitted by various USD exchanges blew out to $1784 in December 2017.
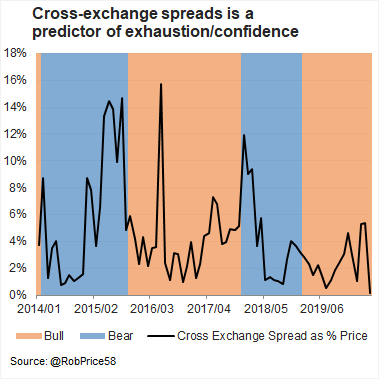
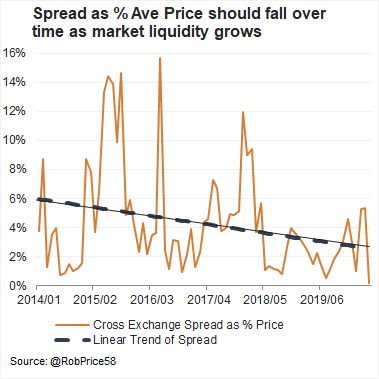
I use bitcoin price spreads to generate an indicator of healthy pricing activity in bitcoin. Similarly, to Google Trends, I normalise the data to account for the assumed tendency towards narrower price spreads (i.e. lower trend in spreads). Unfortunately, we only have one bull market worth of this data so we cannot properly assess the robustness of the indicator. Spreads also blew out during the late 2014/ early 2015 bear market, which is a little surprising and contrary to the logic of the indicator. That being said, subsequent BTC performance has been much weaker when these prices are high and stronger when the spreads are low. Subsequent 1 year compound BTC returns were 27.5% when BTC price spreads were 2 standard deviations above the trend and 88% when below the trend.
At the end of May 2020 price spreads were below the long-run trend suggesting tight price discovery and good price appreciation potential, supporting the bullish indication seen in the Google Trends analysis.
Alternative Store of Value or Speculative Device?
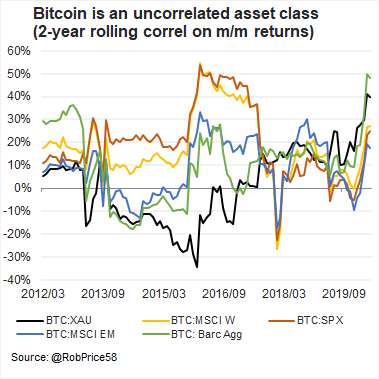
Bitcoin is decentralised digital store of value, which may compete with the traditional financial system in the future. The traditional financial system is cumbersome and overseen by monetary policy committees who are prone towards monetary inflation in response to all economic problems, which means its ripe for competition. I believe that bitcoin is a viable and valuable long-term option. This prospect provides a differentiated and uncorrelated source of return. The 2-year rolling correlation between BTC and traditional asset class month-on-month (m/m) returns are shown below. As a side note, its interesting that the correlation between defensive asset classes like global bonds and gold have increased during this crisis.
Despite the non-correlated source of return, we cannot ignore the influence of the traditional financial system on the functioning of bitcoin’s investment landscape. Bitcoin is a recipient of the same cheap money flows from the traditional financial markets as equities, for example, and can get caught up in the same cycles. Evidence bears this out. BTC bull and bear cycles (the same ones I’ve used throughout the report) hold a reasonable relationship with global equity returns (MSCI World, developed equity). At some point in the future I expect BTC to decouple completely from traditional financial markets, but this could be many years into the future. Currently, most BTC investments (at least the marginal purchases, which tend to drive price changes) are made by people who maintain a bigger proportion of their capital in traditional investments. And while BTC returns certainly hold a different correlation to traditional investments, they are still probably viewed by many as a risky speculation. Hence, when global risk conditions are reasonable, we tend to see better BTC cycles and BTC tends to come under pressure when global markets are troubled.
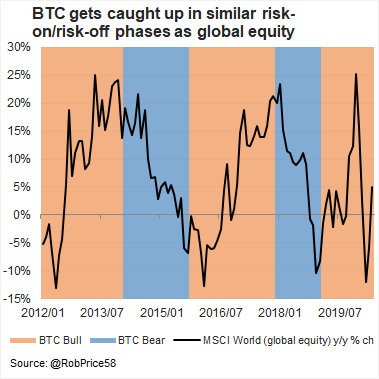
March 2020 was an extreme example - traditional financial markets are experiencing severe and sudden deleveraging as investors re-price global risk, volatility is shooting higher and generating margin calls across the investment landscape. Hardly any investments are spared, including the traditional safe-haven gold, and BTC is no different.
Conclusion
There is significant long-term value in bitcoin. The foundation for this outcome must be based on an intellectual interrogation of central banking, the financial system, interest rates and monetary history. Stock-to-flow and relative value allow us to put numbers to the conceptual understanding, creating wide but constructive bitcoin price targets. Transaction values and network valuation provide a word of caution but if bitcoin is increasingly viewed as a store of value, then these measures could become less relevant as bitcoin won’t be used for small transactions, like coffee. The rest of indicators presented give a green light for bitcoin accumulation and we’ve got a good body of evidence to assess the risks related to the looming bull-market when it arises. Price discovery is good and interest in bitcoin is picking up despite its price decline. The dramatic price drop in March 2020 proves bitcoins susceptibility to traditional financial market strains, which should serve as a warning sign for those who discount the relationship between traditional financial and bitcoin. Central authorities have managed to calm traditional financial markets in Q2 2020 but the tools they’ve used (debt, liquidity, low rates, etc) are fuel to the bitcoin fire. Never has the world needed to consider the worth of decentralised store of value transfer more than now. Never has the world need to investigate the consequences of extreme monetary and fiscal inflation more than now. Bitcoin is the tool, which triggers this investigation!
2 thoughts on “Bitcoin Investment Analysis | Preparing for the coming bull-market”